
Updated October 2026.
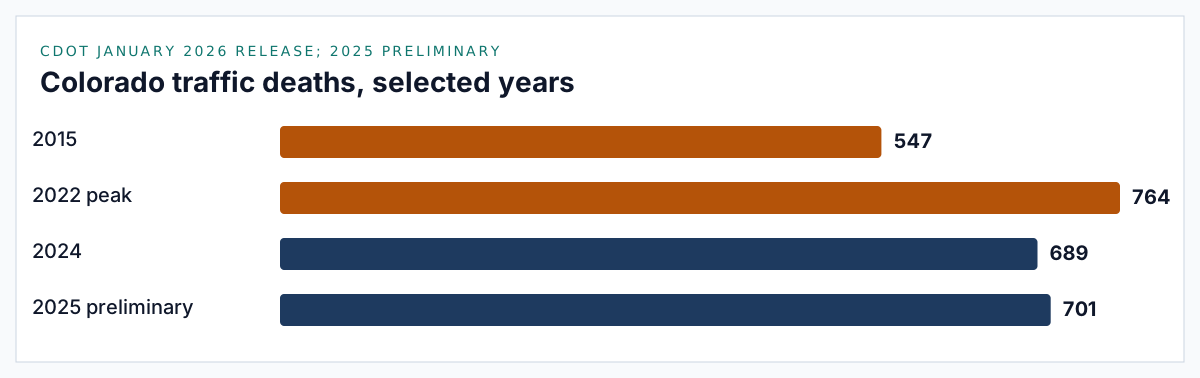
Colorado did not get safer because the calendar flipped. After two years of decline, preliminary CDOT counts show traffic deaths rose again in 2025, and the late-year jump was concentrated on the Front Range, where most of the state's driving, walking, and riding actually happens (CDOT, Jan 2026).
The useful numbers are not the ones that sound like a verdict. They are the ones that keep their definitions: reported crashes on public roads, officer-coded serious injury, hospital discharge coding, and FARS fatalities. Those series do not measure the same people. Mixing them is how a statistics page becomes a rumor.
This hub pulls primary tables from CDOT, CDPHE, Colorado's Highway Safety Office, NHTSA FARS and NCSA, FHWA, and GHSA, and it ranks Denver intersections from the City and County of Denver Open Data traffic-accident file. Every figure below is dated, linked to the origin document, and labeled when it is preliminary. It is a crash-and-injury census, not a case-value page.
Key Takeaways
- CDOT's July 2026 year-to-date chart shows 315 Colorado traffic deaths in 2026, versus 363 at the same point in 2025 (preliminary) (CDOT, Aug 2026).
- Preliminary CDOT data: 701 people were killed on Colorado roadways in 2025 (CDOT, Jan 2026).
- Colorado recorded 121,648 reported motor vehicle crashes in 2019, the last full pre-COVID year in the published statewide series (CDPHE, Jun 2022).
- Crash reports recorded 3,674 serious (evident incapacitating) injuries in Colorado in 2022 (CDPHE, Aug 2024).
- Speed was a factor in 232 Colorado traffic deaths in 2025 (CDOT, Sep 2026).
- Impaired-driving deaths totaled 235 in Colorado in 2025, up 11% from 2024 on the same preliminary release (CDOT, Jan 2026).
- Denver recorded 76 traffic fatalities in 2025, tied with Weld County for the highest county total (CDOT, Jan 2026).
- N Federal Blvd / W 6th Ave recorded 96 crashes coded At Intersection in Denver in 2023–2025, the highest intersection volume in the city's open crash file (Denver Open Data, Sep 2026).
- N Speer Blvd / W Colfax Ave led the same years with 5 fatal-or-serious-injury intersection crashes; volume and severity are different rankings (Denver Open Data, Sep 2026).
- 3,127 Colorado residents were hospitalized for motor-vehicle injuries in traffic or on public roads in 2020 (CHA discharge data analyzed by CDPHE) (CDPHE, Jun 2022).
- 39,254 people died in U.S. motor vehicle traffic crashes in 2024 (FARS 1st release / ARF) (NHTSA FARS, Apr 2026).
- Colorado HSO's FY2024 annual report lists 3,067 serious injuries in traffic crashes for calendar 2024 (State, preliminary through 31 Dec 2024) (Colorado HSO, Jan 2026).
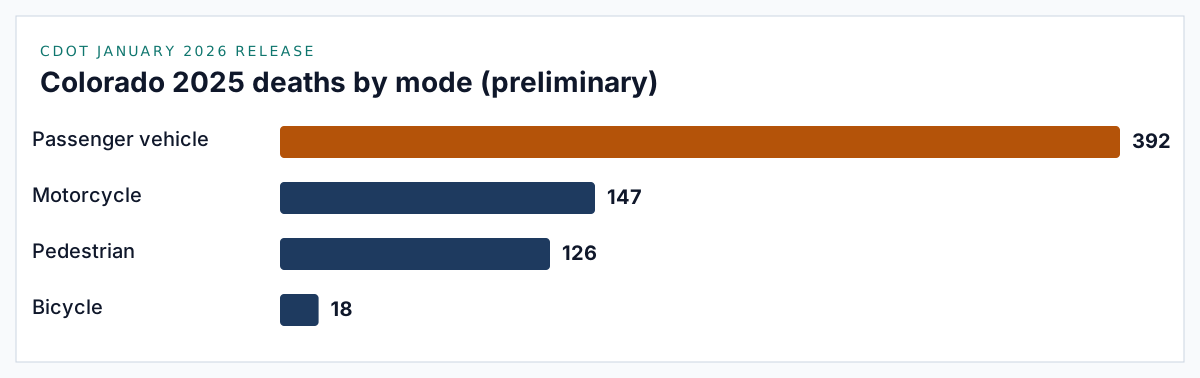
- 126 pedestrians were killed on Colorado roads in 2025 (preliminary) (CDOT, Jan 2026).
- The U.S. fatality rate fell to 1.19 deaths per 100 million VMT in 2024 (NHTSA NCSA, Apr 2026).
- Colorado traffic deaths peaked at 764 in 2022 in CDOT's published trend line (CDOT, Jan 2026).
How many car crashes happen in Colorado each year?
Volume is the part of the record that most "fatality dashboards" never show. Deaths move in the hundreds. Reported crashes move in the tens of thousands. When the crash count collapses and the death count does not, severity is the story, not luck.
What is the statewide reported crash total in a recent full year?
The freshest published table of statewide crash counts is still the 2016–2020 series in the 2022 Problem Identification report. CDOT's crash-data page hosts year listings through 2026, but those files are listings and dashboards, not a citable annual total in a stable PDF.
- Reported crashes totaled 121,149 in 2016 (CDPHE, Jun 2022).
- Reported crashes totaled 119,373 in 2017 (CDPHE, Jun 2022).
- Reported crashes totaled 122,504 in 2018 (CDPHE, Jun 2022).
- Colorado's population in that same table rose from 5.54 million in 2016 to 5.81 million in 2020 (CDPHE, Jun 2022).
- Observed seat-belt use in the same series was 84% in 2016, 88.3% in 2019, and 86.3% in 2020 (CDPHE, Jun 2022).
- CDOT publishes statewide crash-data listings for 2007 through 2026; 2026 is labeled preliminary and rough, and 2021–2026 remain subject to revision (CDOT, Sep 2026).
- CDOT marked the 2025 crash data listing "considered complete" on 23 Jul 2026 and updated the preliminary 2026 listing on 9 Oct 2026 (CDOT, Oct 2026).
- Those listings, reports, and dashboards are protected under 23 U.S.C. § 407 (CDOT, Sep 2026).
- CDOT's crash dashboards should be treated as preliminary; the fatal-crash page is the official current fatality count (CDOT, Sep 2026).
- After an officer completes form DR3447, the Department of Revenue enters the legal record in DRIVES; CDOT receives that feed excluding private-property and counter reports (CDOT, Sep 2026).
How did COVID-year reporting change the crash volume picture?
2020 is the break in the series. Comparing it to a 120,000-crash year without saying so is a reporting error.
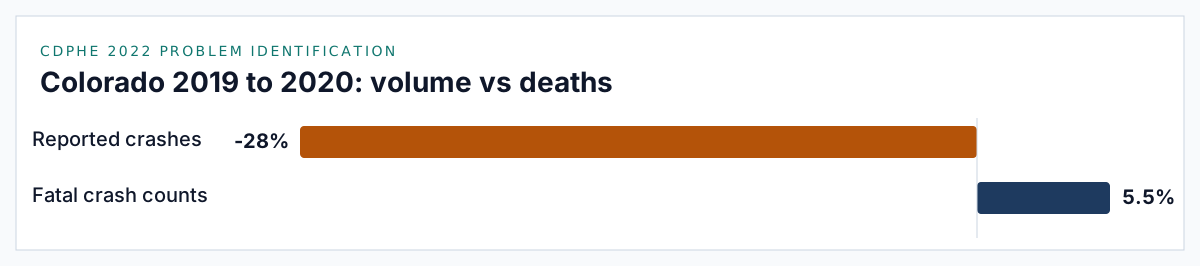
- Reported crashes fell to 87,629 in 2020, a 28.0% one-year drop and a 27.7% five-year drop in the published table (CDPHE, Jun 2022).
- Fatalities in that same COVID year still rose from 596 in 2019 to 622 in 2020 (CDPHE, Jun 2022).
- Fatal crash counts in Colorado increased 5.5% from 2019 to 2020 (CDPHE, Jun 2022).
- Nationally, FARS recorded 36,355 U.S. traffic deaths in 2019 and 39,007 in 2020 (NHTSA FARS, Apr 2026).
- The U.S. fatality rate jumped from 1.11 per 100 million VMT in 2019 to 1.34 in 2020 (NHTSA FARS, Apr 2026).
- U.S. VMT in the FARS national table fell to 2,904 billion in 2020 (NHTSA FARS, Apr 2026).
Fewer reported crashes and more deaths in the same year is the COVID signature: less traffic, worse crashes. Do not annualize 2020 as "the new normal."
How many people die or are seriously injured in Colorado traffic crashes?
Deaths are a census. "Serious injury" is an officer's box on a crash form. Hospitalization is a billing code. If a page adds those three numbers, it is inventing a fourth definition.
What were Colorado traffic deaths in the latest preliminary year?
CDOT's January 2026 release is the current official statewide story, and it is marked preliminary pending edit checks. Prior-year lines in that release already disagree with earlier HSO snapshots. That is expected. It is not a reason to pick the larger number and hide the smaller one.
- CDOT's 2025 release counts 689 traffic deaths in 2024 (CDOT, Jan 2026).
- The same trend line starts at 547 deaths in 2015 (CDOT, Jan 2026).
- Problem ID fatalities were 608 (2016), 648 (2017), 632 (2018) in the 2016–2020 table (CDPHE, Jun 2022).
- Motor vehicle fatalities increased from 691 in 2021, an 11% year-over-year rise into 2022 in the 2024 executive summary (CDPHE, Aug 2024).
- Colorado HSO reported 720 traffic fatalities in 2023 (Colorado HSO, Jan 2026).
- The same HSO table lists 681 2024 fatalities (State, preliminary through 31 Dec 2024), which later moved in CDOT's January 2026 comparison line (Colorado HSO, Jan 2026).
- Passenger-vehicle deaths in 2025 were 392, up 5% from 2024 (preliminary) (CDOT, Jan 2026).
- Motorcycle deaths in 2025 were 147, down 11% from 2024 (preliminary) (CDOT, Jan 2026).
- Unbuckled seat-belt deaths in 2025 were 188 (preliminary) (CDOT, Jan 2026).
- Bicycle deaths in 2025 were 18, up 29% from 2024 (preliminary) (CDOT, Jan 2026).
- Construction-zone deaths in 2025 were 9, down 70% from 2024 (preliminary) (CDOT, Jan 2026).
- Until November and December, 2025 deaths were on track for a 7% decline; those two months jumped 70% versus the same period in 2024 (CDOT, Jan 2026).
- Motorcyclist fatalities in that late-year window rose 167% versus the same period a year earlier (CDOT, Jan 2026).
- Colorado's 2022 fatality rate reached 13.1 deaths per 100,000 persons (CDPHE, Aug 2024).
- In 2022 Colorado had 1.42 fatalities per 100 million VMT, versus 1.33 in the U.S. figure cited in that report (CDPHE, Aug 2024).
- Among all age groups in 2022, males made up about 75% of fatalities (CDPHE, Aug 2024).
- The 25–34 age group had the most deaths in 2022, with 169 fatalities (CDPHE, Aug 2024).
- 270 males aged 21–44 died in 2022, compared with 194 female fatalities across all ages (CDPHE, Aug 2024).
What do 2026 year-to-date Colorado traffic deaths show so far?
Year-to-date counts are early-notification numbers. They will be revised, and a partial year is not a trend line. Read them against the same window a year earlier, never against a full-year total.
- CDOT's July 2026 year-to-date chart shows 315 traffic deaths in 2026 and 363 at the same point in 2025 (CDOT, Aug 2026).
- The same chart counts 85 impairment-related deaths year to date in 2026, versus 131 at the same point in 2025 (CDOT, Aug 2026).
- CDOT's mode chart in that update, labeled through June, shows 190 car/truck, 63 motorcycle, 46 pedestrian, and 9 bicycle deaths in 2026. Its cutoff differs from the year-to-date chart, so the two totals do not match (CDOT, Aug 2026).
- From January to June 2026, CDOT counted 72 fatalities with suspected impairment, a 28.7% decrease from 101 in the same period of 2025 (preliminary, as of 18 Aug 2026) (CDOT, Sep 2026).
- The same January–June window counted 126 suspected-impairment deaths in 2022, 108 in 2023, and 97 in 2024 (CDOT, Sep 2026).
- The 2026 "100 Deadliest Days," Memorial Day to Labor Day, ended with 37 fatalities involving suspected impairment, down from 82 in 2025 (CDOT, Sep 2026).
Motorcycle deaths are the share to watch in a partial year. The Colorado motorcycle accident statistics hub tracks that series on its own.
CDOT's fatal-crash dashboard is the current count; suspected impairment on an early notification is not a FARS toxicology result (CDOT, Sep 2026).
How many serious (incapacitating) injuries do state crash reports record?
"Serious injury" in these tables means the responding officer coded evident incapacitating: the person could not walk, drive, or continue normal activities. It is not a hospital diagnosis.
- Serious injuries were 2,956 (2016), 2,884 (2017), 3,112 (2018), 3,190 (2019), and 3,164 (2020) (CDPHE, Jun 2022).
- That 2016–2020 serious-injury series rose 7.0% over five years (CDPHE, Jun 2022).
- The rate of serious injuries per 100 million VMT increased 26% over the six years preceding the 2024 executive summary (CDPHE, Aug 2024).
- HSO's FY2024 serious-injury target was 3,356; the State actual beat that target and is a different year than the 2022 crash-report count (Colorado HSO, Jan 2026).
- Observed seat-belt use in the FY2024 HSO survey was 88.19%, below the 89% target (Colorado HSO, Jan 2026).
- Unrestrained passenger-vehicle occupant fatalities in that HSO table were 169 in 2024 (State) (Colorado HSO, Jan 2026).
- Work-zone worker fatalities in the same HSO table were 16 in 2024 (State) (Colorado HSO, Jan 2026).
What driving behaviors show up most in Colorado fatal crashes?
Speed, impairment, and missing a belt keep showing up in the same fatal files. They overlap. Adding the percentages will overshoot 100%. CDOT says so explicitly; treat co-occurrence as the default, not a rounding error.
If the crash involved a serious injury on a Front Range road, the next useful step is a free consultation with a Denver car accident lawyer who will read the report before anyone writes a narrative for you.
How often is speeding a factor in Colorado traffic deaths?
- Speeding-related fatalities were 211 (2016), 230 (2017), 210 (2018), 239 (2019), and 287 (2020) (CDPHE, Jun 2022).
- Speeding-related deaths were 202 (29% of fatalities) in 2021 and 291 (38%) in 2022, a 31% increase (CDPHE, Aug 2024).
- Speed was a factor in 237 fatalities in 2024 (CDOT, Aug 2025).
- 1,274 people died in Colorado speeding-related crashes over the five years ending 2024 (CDOT, Aug 2025).
- CDOT's speeding page states Colorado lost more than 1,200 lives to speeding between 2021 and 2025 (CDOT, Sep 2026).
- The 2024 speeding-death counties were Adams (32), El Paso (25), and Denver (23) (CDOT, Aug 2025).
- In 2022 the top speeding-fatality counties were Adams (36), El Paso (25), Denver (24), Arapahoe (22), and Pueblo (22) (CDPHE, Aug 2024).
- 71% of Colorado drivers in CDOT's 2025 Driver Behavior Report said they drove over the limit on main highways at least some of the time (CDOT, Sep 2026).
- 48% admitted speeding on main city streets (CDOT, Aug 2025).
- CSP troopers investigated more than 560 fatal and injury crashes involving a speeding driver in 2024 (CDOT, Aug 2025).
- In 2025, troopers investigated more than 500 fatal and injury crashes that involved a speeding driver (CDOT, Sep 2026).
- In 2025, troopers issued more than 43,900 speeding citations (CDOT, Sep 2026).
- El Paso County had 78 total traffic deaths and more than 450 serious bodily injuries in 2024 in that speeding release (CDOT, Aug 2025).
- HSO's C-6 speeding-related fatality figure for 2024 is 105 (State), against a target of 289. That is a different operational definition than CDOT's 237-death speeding count. Do not blend them (Colorado HSO, Jan 2026).
- Nationally, 11,288 people died in speeding-related crashes in 2024 (NHTSA, Sep 2026).
- Speeding was a contributing factor in 29% of U.S. traffic fatalities in 2024 (NHTSA, Sep 2026).
- U.S. speeding-related fatalities were 11,913 in 2023 (NHTSA NCSA, Apr 2026).
- 19% of all drivers involved in U.S. fatal crashes in 2024 were speeding (NHTSA NCSA, Apr 2026).
- Grant-funded enforcement in Colorado issued 13,632 speeding citations in 2024 (Colorado HSO, Jan 2026).
How often is impairment a factor?
"Impaired" on a January CDOT release is not the same as FARS alcohol-impaired (BAC ≥ .08, with imputation for missing tests). CDOT's fatal-crash page warns that suspected impairment is the officer's opinion at the scene.
- Alcohol-impaired (BAC ≥ .08) fatalities were 163 (2016), 177 (2017), 192 (2018), 164 (2019), and 151 (2020) (CDPHE, Jun 2022).
- An alcohol-impaired driver was involved in 214 fatalities in 2021 and 260 in 2022, an 18% increase (CDPHE, Aug 2024).
- The share of fatalities involving an alcohol-impaired driver rose from 31% in 2021 to 34% in 2022 (CDPHE, Aug 2024).
- Speed claimed more 2024 lives than impaired driving (215) and unbuckled crashes (189) in CDOT's August 2025 speeding release (CDOT, Aug 2025).
- Top 2022 impaired-driving fatality counties: Adams (29), Denver (29), El Paso (21), Arapahoe (19), Jefferson (17) (CDPHE, Aug 2024).
- HSO reports 178 alcohol-impaired driving fatalities for FARS 2023 (Colorado HSO, Jan 2026).
- Fatalities involving a driver or motorcycle operator testing at or above 5 ng of Delta-9 THC were 97 (FARS 2023) in the HSO table (Colorado HSO, Jan 2026).
- Drug-positive drivers in fatal crashes numbered 91 in Colorado in 2020 (CDPHE, Jun 2022).
- CDOT planned 15 impairment enforcement campaigns in the 2025 safety write-up (CDOT, Jan 2026).
- U.S. alcohol-impaired-driving fatalities were 11,904 in 2024, 30% of all traffic deaths (NHTSA, Sep 2026).
- That 2024 U.S. alcohol-impaired count was 478 lower than 12,382 in 2023 (NHTSA NCSA, Apr 2026).
- The U.S. alcohol-impaired fatality rate was 0.36 per 100 million VMT in 2024 (NHTSA NCSA, Apr 2026).
- NHTSA's drunk-driving page frames 2024 as about 32 people killed per day, or one every 44 minutes (NHTSA, Sep 2026).
What do we know about distracted driving in fatal crashes?
Officer-reported distraction is incomplete. CDOT and CDPHE both warn against strong trend claims. Keep this short.
- A distracted driver is involved in around 7–11% of Colorado motor vehicle fatalities in the 2016–2022 series; measurement is difficult and underreported (CDPHE, Aug 2024).
- Distracted drivers involved in a fatal crash numbered 67 (2016), 67 (2017), 53 (2018), 35 (2019), and 54 (2020) (CDPHE, Jun 2022).
- HSO recorded 34 fatalities involving a distracted driver in 2024 (State), against a target of 68 (Colorado HSO, Jan 2026).
- Nationally, fatalities in distraction-affected crashes fell by 75 from 2023 to 2024, a 2.3% decrease (NHTSA NCSA, Apr 2026).
Where along the Front Range are fatalities concentrated?
Most of Colorado's population, VMT, and trauma-center demand sit on the I-25/I-70 spine. When CDOT says the late-2025 surge was "most visible along the Front Range," that is a geography statement, not a vibe.
If you were hurt in a Denver, Aurora, or Front Range crash, Conduit Law can review the police report, coverage, and filing window in a free consult. For El Paso County crashes, see the Colorado Springs car accident attorney page; for crashes involving a truck or work vehicle, see Denver commercial vehicle accidents.
Which Colorado cities and counties led traffic deaths in the latest year?
City totals and county totals are not interchangeable. Denver is both. Weld's county total is not a city total.
- Aurora recorded 55 traffic fatalities in 2025, up 22% from 2024 (preliminary) (CDOT, Jan 2026).
- Colorado Springs recorded 49, up 4% (preliminary) (CDOT, Jan 2026).
- Pueblo (city) recorded 21, unchanged from 2024 (preliminary) (CDOT, Jan 2026).
- Lakewood recorded 16, down 24% (preliminary) (CDOT, Jan 2026).
- Weld County tied Denver at the top of the 2025 county list (preliminary) (CDOT, Jan 2026).
- El Paso County recorded 75 deaths, down 4% (preliminary) (CDOT, Jan 2026).
- Adams and Arapahoe counties each recorded 59 (Adams down 30%, Arapahoe up 7%) (preliminary) (CDOT, Jan 2026).
- Jefferson County recorded 47, down 13% (preliminary) (CDOT, Jan 2026).
- Pueblo County recorded 40, up 60% (preliminary) (CDOT, Jan 2026).
- Larimer County recorded 36, up 3% (preliminary) (CDOT, Jan 2026).
- Douglas County recorded 26, up 37% (preliminary) (CDOT, Jan 2026).
- Boulder County recorded 19, down 17% (preliminary) (CDOT, Jan 2026).
- In 2020 the top five fatality counties were El Paso (85), Weld (54), Adams (53), Arapahoe (52), and Denver (51) (CDPHE, Jun 2022).
- Among large counties, Pueblo stood out at 19 fatalities per 100,000 population (2020–2022 average) (CDPHE, Aug 2024).
- Morgan County averaged 35 deaths per 100,000 (31 fatalities across 2020–2022) (CDPHE, Aug 2024).
- Montezuma County averaged 30 per 100,000 (24 fatalities across 2020–2022) (CDPHE, Aug 2024).
- Rural-area fatal crashes were 295 (43%) in 2021 and 299 (39%) in 2022 (CDPHE, Aug 2024).
- CDOT's Strategic Transportation Safety Plan aims to cut fatalities and serious injuries 5% per year, or 22.6% by 2030 (CDOT, Jan 2026).
- That 2025 release also cites support for 130 law enforcement, public health, and traffic safety organizations (CDOT, Jan 2026).
What are the most dangerous intersections in Denver?
N Federal Blvd / W 6th Ave recorded 96 crashes coded At Intersection in the City and County of Denver traffic-accident file from 2023 through 2025, the most of any intersection in that window (Denver Open Data, Sep 2026). That is a volume ranking, not a severity ranking: N Speer Blvd / W Colfax Ave led the same years with 5 crashes that included a fatality or a serious injury (Denver Open Data, Sep 2026). A crash total is a location count. It is not a finding of fault.
Denver publishes these records as NIBRS traffic-accident offenses. The table below counts unique incident_id rows with ROAD_DESCRIPTION = At Intersection and first_occurrence_date in calendar 2023, 2024, and 2025. Intersection-related, mid-block, parking-lot, and ramp records are excluded. Street names on either side of a slash are sorted so Federal / 6th and 6th / Federal do not split a rank.
| Rank | Intersection | Total crashes | Fatal or serious-injury crashes | Notable factors |
|---|---|---|---|---|
| 1 | N Federal Blvd / W 6th Ave | 96 | 4 | Highest volume. 4 motorcycle-involved. Count rose 19 (2023) to 48 (2025). |
| 2 | E MLK Blvd / N Central Park Blvd | 72 | 2 | Central Park. Count rose 18 to 33. |
| 3 | S Santa Fe Dr / W Mississippi Ave | 71 | 4 | 6 serious-injury persons in 4 F+SI crashes. |
| 4 | S Platte River Dr / W Mississippi Ave | 65 | 2 | 2 bicycle-involved. |
| 5 | N Speer Blvd / W Colfax Ave | 62 | 5 | Severity lead among volume leaders. 1 fatality, 7 serious-injury persons, 3 pedestrian. |
| 6 | E MLK Blvd / N Quebec St | 56 | 0 | High volume, 0 F+SI. Volume is not severity. |
| 7 | E 56th Ave / N Tower Rd | 53 | 2 | Gateway - Green Valley Ranch. |
| 8 | E Hampden Ave / S Tamarac Dr | 53 | 2 | Tied with 56th / Tower on volume. |
| 9 | N Speer Blvd / W 8th Ave | 52 | 1 | 2 pedestrian and 2 bicycle-involved. |
| 10 | I-70 EB / N Peoria St | 52 | 0 | Dataset label I70 HWYEB. 0 F+SI. |
E Elmendorf Dr / N Tower Rd had only 13 At Intersection crashes and 5 fatal-or-serious-injury crashes, tied with Speer / Colfax for the severity lead (Denver Open Data, Sep 2026). Pedestrian, bicycle, and motorcycle flags are incident indicators in the same file, not a separate census.
Which Denver corridors sit on the High Injury Network?
DOTI's High Injury Network is a street layer, not an intersection list. In the published layer (crash years 2016–2021, methodology revised in 2023), Tier 1 and Tier 2 streets together account for 56% of all crashes (Denver DOTI, Aug 2026). Ranking that layer by segment count, Colfax Ave, Federal Blvd, and Sheridan Blvd each have 37 HIN segments, the most in the city; Colfax has 26 Tier 1 segments and the highest segment CrashRate (Denver DOTI, Aug 2026). Alameda Ave has 33 segments. Colorado Blvd has 29 (Denver DOTI, Aug 2026).
The 2022 Vision Zero Action Plan names East Colfax, South Federal, and South Broadway / Lincoln as Safety Focus Areas and notes that the HIN is mostly arterial streets, many of them managed by CDOT. Colfax (US 40) and Federal (US 287) are those state highways. This page does not scrape CDOT dashboards for a second intersection ranking.
What to do after a crash at one of these intersections
- Get medical care. An officer's injury box is not a diagnosis.
- If you can do it safely, photograph the signal heads, lane lines, skid marks, and vehicle rest positions. Intersection geometry is evidence. It is not a verdict.
- Ask for the incident number. Denver's public file is keyed to
incident_id. - Do not treat the first insurer call as the full coverage picture. Colorado is an at-fault state. The Colorado personal injury claim process is the sequence, not a shortcut.
- A Denver car accident lawyer can review the report, coverage, and filing window. Crash location does not prove fault.
How do I find Colorado traffic accident records from a past year, like September 2017?
People search for a single crash by month and year. The public statistics do not work that way. Statewide tables report full calendar years; the crash-level detail sits in CDOT's annual listings and NHTSA's FARS case files. This page does not publish a month-by-month count for 2017, because no primary table we can cite shows one.
What the published record does show for 2017:
- Colorado had 119,373 reported motor vehicle crashes in 2017 (CDPHE, Jun 2022).
- Colorado recorded 648 traffic fatalities in 2017, up from 608 in 2016 (CDPHE, Jun 2022).
- Crash reports coded 2,884 serious injuries in 2017 (CDPHE, Jun 2022).
- CDOT posts a separate statewide crash data listing for 2017; only the 2021–2026 listings are flagged as subject to revision (CDOT, Oct 2026).
Earlier preliminary counts for any year can differ from the final table. Use the latest published table, and say which book a number came from.
To look up one specific crash:
- Start with the year's listing. CDOT's crash-data page links a listing and a data dictionary for each year from 2007 forward (CDOT, Oct 2026).
- Fatal crashes are also in FARS. NHTSA's FARS Encyclopedia is the national census of fatal crashes and is the cross-check for date, county, and people killed (NHTSA FARS, Apr 2026).
- For the report itself, ask the agency. CDOT routes general crash-data requests through its open-records page (CDOT, Oct 2026). The officer's crash report comes from the agency that worked the crash.
- Remember § 407. CDOT's crash listings are safety data, not litigation exhibits (CDOT, Oct 2026).
An old crash also raises a timing question. Colorado's filing deadlines run from the crash or the death, and they differ by claim; the Colorado personal injury statute of limitations and the Colorado wrongful death guide lay out the general rules. Whether one applies to a specific crash is a question for a lawyer who has read the file.
What is the hospital burden from Colorado motor vehicle crashes?
A crash-report "serious injury" can be a broken bone that keeps someone from driving home. A hospital discharge for "motor vehicle, traffic" is a billed inpatient stay. CDPHE analyzes Colorado Hospital Association data for the Problem ID reports. Do not add 3,674 to 3,127.
How many Colorado residents were hospitalized for traffic-related motor vehicle injuries in a recent primary year?
- The age-adjusted hospitalization rate for Colorado residents injured in motor vehicle crashes fell 4.9% from 2016 to 2020 (CDPHE, Jun 2022).
- That rate fell 6% from 2019 to 2020 even as Colorado's population rose about 5% (CDPHE, Jun 2022).
- Adults 21 to 24 had the highest age-specific hospitalization rate in 2020 (CDPHE, Jun 2022).
- Males accounted for two-thirds of those hospitalized from crashes in 2020 (CDPHE, Jun 2022).
- Most people seriously injured in 2020 were riding in a vehicle (96%); pedestrians were almost 3% (CDPHE, Jun 2022).
- Unrestrained occupant fatalities were 190 in 2020, 54.1% of 351 occupant deaths that year (CDPHE, Jun 2022).
- Unrestrained occupant deaths rose from 231 in 2021 to 241 in 2022, while the unrestrained share of occupant fatalities moved from 52% to 49% (CDPHE, Aug 2024).
- Motorcycle fatalities rose from 137 in 2021 to 149 in 2022; 52% of fatally injured motorcycle occupants were unhelmeted in 2022 (CDPHE, Aug 2024).
- Motorcycle occupants were 24% of fatally injured occupants in 2022, the same share as 2021 and still above pre-pandemic levels (CDPHE, Aug 2024).
- Pedestrian deaths were 108 in 2022, up from 87 in 2021, a 24% increase, and 14% of 2022 fatalities (CDPHE, Aug 2024).
- Bicycle deaths held at 15 each year from 2020 to 2022 (CDPHE, Aug 2024).
- Pedestrian fatalities in the 2016–2020 table were 79, 92, 89, 73, and 87 (CDPHE, Jun 2022).
- Motorcyclist fatalities in that table were 125, 103, 103, 103, and 140 (CDPHE, Jun 2022).
- Unhelmeted motorcyclist deaths were 82, 72, 58, 54, and 74 across 2016–2020 (CDPHE, Jun 2022).
- Drivers aged 15–20 in fatal crashes numbered 59, 91, 81, 76, and 83 (CDPHE, Jun 2022).
- HSO recorded 119 pedestrian fatalities and 14 bicyclist fatalities in 2024 (State) (Colorado HSO, Jan 2026).
- HSO recorded 164 motorcyclist fatalities and 73 unhelmeted motorcyclist fatalities in 2024 (State) (Colorado HSO, Jan 2026).
- Drivers aged 20 or younger involved in fatal crashes numbered 99 in 2024 (State) (Colorado HSO, Jan 2026).
- CDOT scheduled 3 Click It or Ticket campaigns in the 2025 safety plan summary (CDOT, Jan 2026).
- CDPHE's motor-vehicle data-linkage project joins crash reports to ED, hospital discharge, death, and trauma-registry files with CDOT, CDOR, STRAC, CHA, and the State Trauma Registry (CDPHE, Sep 2026).
How does Colorado compare with the national fatal-crash picture?
National FARS is context, not a local diagnosis. Colorado's rate has run near or below the U.S. rate in some years and above it in 2022. Use the same year and the same definition, or do not compare.
How many people died in U.S. traffic crashes in the latest FARS year?
- U.S. traffic deaths were 41,025 in 2023, 42,721 in 2022, and 43,230 in 2021 (NHTSA FARS, Apr 2026).
- Fatal crashes (not people) numbered 36,297 in 2024, down from 37,769 in 2023 (NHTSA FARS, Apr 2026).
- Police-reported U.S. crashes were estimated at 6,180,241 in 2024, up 0.7% from 6,138,474 in 2023 (NHTSA NCSA, Apr 2026).
- An estimated 2.42 million people were injured in U.S. crashes in 2024, versus 2.44 million in 2023 (NHTSA NCSA, Apr 2026).
- The U.S. injury rate was 74 per 100 million VMT in 2024, down from 75 in 2023 (NHTSA NCSA, Apr 2026).
- FHWA recorded 3,294,031 million U.S. vehicle-miles in 2024 and 3,246,817 million in 2023 (FHWA, Feb 2026).
- Passenger-vehicle occupant deaths fell to 22,713 in 2024 (NHTSA NCSA, Apr 2026).
- Passenger-car occupant deaths fell to 10,675 in 2024 (NHTSA NCSA, Apr 2026).
- U.S. motorcyclist deaths were 6,228 in 2024 (NHTSA FARS, Apr 2026).
- U.S. pedestrian deaths were 7,080 in 2024 (NHTSA FARS, Apr 2026).
- U.S. pedalcyclist deaths were 1,103 in 2024 (NHTSA FARS, Apr 2026).
- Driver deaths were 18,686 and passenger deaths 5,746 in 2024 (NHTSA FARS, Apr 2026).
- People killed "inside the vehicle" were 62% of U.S. traffic deaths in 2024; people killed "outside the vehicle" were 38% (NHTSA NCSA, Apr 2026).
- Urban U.S. traffic deaths were 22,905 in 2024; rural deaths were 16,006 (NHTSA NCSA, Apr 2026).
- From 2015 to 2024, urban U.S. traffic deaths rose 30% while rural deaths fell 9.6% (NHTSA NCSA, Apr 2026).
- The U.S. rate was 11.54 deaths per 100,000 population in 2024 (NHTSA FARS, Apr 2026).
- The U.S. rate was 12.69 per 100,000 registered vehicles and 16.37 per 100,000 licensed drivers in 2024 (NHTSA FARS, Apr 2026).
- Among passenger-vehicle occupants killed in 2024 with known restraint use, 48% were unrestrained (NHTSA NCSA, Apr 2026).
- NOPUS estimated front-seat belt use at 91.2% in 2024, down from 91.9% in 2023 (not statistically significant) (NHTSA NCSA, Apr 2026).
- 43% of the 41,912 passenger-vehicle drivers in 2024 fatal crashes had at least one of three factors: alcohol impairment, speeding, or being unrestrained (NHTSA NCSA, Apr 2026).
- Nighttime U.S. fatalities fell to 20,971 in 2024; weekend fatalities fell to 16,128 (NHTSA NCSA, Apr 2026).
- GHSA projects 6,732 U.S. pedestrian deaths in 2025, a 7% decline from 7,237 in 2024 (GHSA, Jul 2026).
- GHSA's Colorado pedestrian series is 76 (2019), 87 (2020), 88 (2021), 107 (2022), 136 (2023), 120 (2024), and 129 preliminary adjusted 2025. That 2025 GHSA line is not CDOT's 126-death preliminary count; different books, both labeled preliminary (GHSA, Jul 2026).
- GHSA's Colorado pedestrian rate moved from 2.05 per 100,000 in 2024 to a projected 2.19 in 2025 (GHSA, Jul 2026).
- 8.1% of U.S. pedestrian fatalities in 2024 were reported as involving speeding (GHSA, Jul 2026).
- GHSA's 2025 projection is about 18 pedestrian deaths per day nationwide (GHSA, Jul 2026).
- NHTSA's 2024 children fact sheet lists 689 total Colorado traffic fatalities in 2024 and 18 child traffic fatalities (2.6%, rate 1.82 per 100,000 children) (NHTSA NCSA, Jun 2026).
- NHTSA's state performance-target table records Colorado 2021 performance of 660.0 fatalities and 3,356.0 serious injuries (NHTSA, May 2026).
- That same NHTSA table lists Colorado 2021 unrestrained occupant deaths at 226.0, alcohol-impaired at 216.0, and speed-related at 289.0 (NHTSA, May 2026).
- Colorado 2021 motorcyclist deaths in that table were 148.0, unhelmeted 75.0, young drivers in fatal crashes 105.0, pedestrians 115.0, and observed seat-belt use 87.0% (NHTSA, May 2026).
- FHWA counted 5,276,703 motor vehicles registered in Colorado in 2024, including 1,356,526 automobiles and 176,484 motorcycles (FHWA, Jan 2026).
- Colorado National Highway System travel was 34,590 million vehicle-miles in 2024 (9,550 rural, 25,040 urban) (FHWA, Nov 2025).
- HSO's C-3 fatalities/VMT line is 1.32 using FARS 2023, against a 1.24 target (Colorado HSO, Jan 2026).
- Pedestrian and bicyclist deaths in Colorado have increased 34% since 2016, while passenger-vehicle occupant deaths increased less than 3%, per CDOT's 2024 speeding release (CDOT, Aug 2025).
- 50% of speeding passenger-vehicle drivers in U.S. fatal crashes in 2024 were not wearing seat belts (NHTSA, Sep 2026).
- 39% of men 15–20 who were driving, speeding, and involved in fatal crashes in 2024 were in that speeding-and-young-male cell on NHTSA's speeding page (NHTSA, Sep 2026).
Methodology and Sources
Stats on this page come only from origin publishers: CDOT news and safety pages, CDOT/CDPHE Problem Identification PDFs, the Colorado HSO FY2024 Annual Report, NHTSA FARS and NCSA Traffic Safety Facts, FHWA Highway Statistics, GHSA's state pedestrian census, and the City and County of Denver Open Data Catalog. Aggregator listicles are not sources. The page is refreshed monthly; preliminary 2025 and 2026 year-to-date CDOT fatality totals will move.
Denver intersection ranks were calculated from the Traffic Accidents (Offenses) feature service (ArcGIS item db00bd99ea534d8987e0913a191ebe19), pulled 17 Sep 2026. Universe: unique incident_id, ROAD_DESCRIPTION = At Intersection, first_occurrence_date in 2023–2025 (53,847 unique incidents citywide; 17,685 At Intersection). Volume rank is total crashes. Severity rank is crashes with FATALITIES > 0 or SERIOUSLY_INJURED > 0. Pedestrian and bicycle counts use pedestrian_ind and bicycle_ind. Motorcycle counts use vehicle-type and injury-mode fields containing motorcycle. Corridor ranks count High Injury Network segments by StreetName in ArcGIS item 2dfeecb78f1a4aa982b12d07dceba270 (layer updated 7 Aug 2026). Reproducible output: data/denver-intersections-2023-2025.csv and data/denver-hin-corridors.csv.
Data risks, in the order they actually break pages:
- 23 U.S.C. § 407. CDOT crash listings and dashboards are protected. Use them for safety analysis, not as a discovery exhibit.
- Preliminary vs final. 2025 CDOT deaths are preliminary. 2024 statewide deaths appeared as 681 in the HSO FY2024 table and 689 in CDOT's January 2026 release. FARS 2024 for Colorado is 689 in NHTSA's children fact sheet.
- Definition conflicts. Crash-report serious injury (evident incapacitating) is not CHA/CDPHE hospitalization and is not a FARS fatality. Suspected impairment on an early fatal blotter is not FARS BAC ≥ .08. HSO "speeding-related" (105 in 2024 State) is not CDOT's 237 speeding deaths.
- Distraction undercount. Officer-reported distraction is incomplete. CDOT warns against strong trend claims.
- COVID crash drop. 87,629 total crashes in 2020 are not comparable to ~120,000 pre-2020 years without the caveat.
- Source lag. Statewide total crash tables in published Problem ID PDFs lag fatality news releases. This page prefers the newest stable URL and keeps the older table when it is still the last published annual total.
- Overlapping causes. Speed, impairment, restraint, and distraction co-occur. Do not sum factor shares to 100%.
- No case outcomes. This hub is crash, fatality, injury, and hospital statistics. It does not publish settlements, verdicts, or case-value averages.
- Denver intersection file. One offense row is not always one crash; this page dedupes on
incident_id.At Intersectionis notIntersection Related. Officer-codedSERIOUSLY_INJUREDin the Denver file is not CDOT's statewide serious-injury total and is not a FARS fatality. CrashRate on the HIN layer is a GIS locator score, not a crash count. - Location is not fault. A high crash count at an intersection does not assign negligence to any driver, owner, or public entity.
Glossary
- FARS: Fatality Analysis Reporting System (NHTSA census of fatal crashes)
- NCSA: National Center for Statistics and Analysis (NHTSA statistical unit)
- CRSS: Crash Report Sampling System (national injury/PDO estimates)
- VMT: vehicle miles traveled
- HSO: Colorado Highway Safety Office
- CDOT: Colorado Department of Transportation
- CDPHE: Colorado Department of Public Health and Environment
- CHA: Colorado Hospital Association discharge data
- BAC: blood alcohol concentration
- NOPUS: National Occupant Protection Use Survey
- GHSA: Governors Highway Safety Association
- FHWA: Federal Highway Administration
- SHSP: Strategic Highway Safety Plan / Strategic Transportation Safety Plan
- HIN: High Injury Network (Denver DOTI street layer of disproportionate death and serious-injury)
- DOTI: Denver Department of Transportation and Infrastructure
- NIBRS: National Incident-Based Reporting System
Sources
- CDOT, Warm weather coincides with increase in traffic deaths in 2025
- CDOT Speeding
- CDOT, Speeding claimed 237 lives on Colorado roads last year
- CDOT Crash Data
- CDOT Fatal Crash Data
- CDOT, Colorado Fatality Data, August 2026
- CDOT, Thirty-five deaths with suspected impairment occurred during 100 Deadliest Days this summer
- CDOT open records (CORA) requests
- CDOT 2024 Problem Identification Executive Summary (prepared by CDPHE)
- CDOT/CDPHE 2022 Problem Identification Statewide Report
- Colorado HSO Fiscal Year 2024 Annual Report
- CDPHE motor vehicle data linkage briefs
- NHTSA FARS Encyclopedia
- NHTSA NCSA, Overview of Motor Vehicle Traffic Crashes in 2024 (DOT HS 813 791)
- NHTSA NCSA, Children: 2024 Data
- NHTSA Speeding
- NHTSA Drunk Driving
- NHTSA State Performance Targets
- GHSA, Pedestrian Traffic Fatalities by State: 2025 Preliminary Data
- GHSA pedestrian 2025 landing
- FHWA Highway Statistics 2024, Table VM-1
- FHWA Highway Statistics 2024, Table MV-1
- FHWA Highway Statistics 2024, Table HM-44
- Denver Open Data, Traffic Accidents (Offenses)
- Denver Open Data, Traffic Accidents ArcGIS item
- Denver DOTI, High Injury Network
- Denver Vision Zero Action Plan (2022)
- Denver Vision Zero