
Updated September 2026.
A fall in a vital-statistics file is not a lawsuit. Public-health agencies count unintentional falls as an injury mechanism — a trip, a slip, a drop from standing height, coded ICD-10 W00–W19 on a death certificate or an E-code on a hospital discharge. That census is not a count of wet-floor claims, icy-sidewalk notices, or premises-liability filings. If you need the legal track, that is a different page. This one is the injury record.
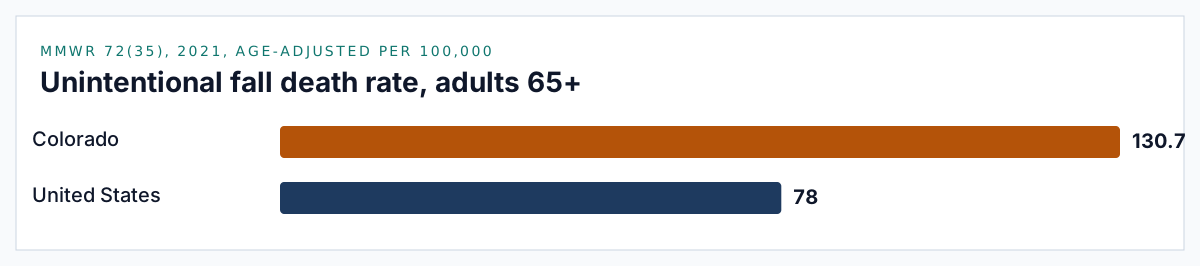
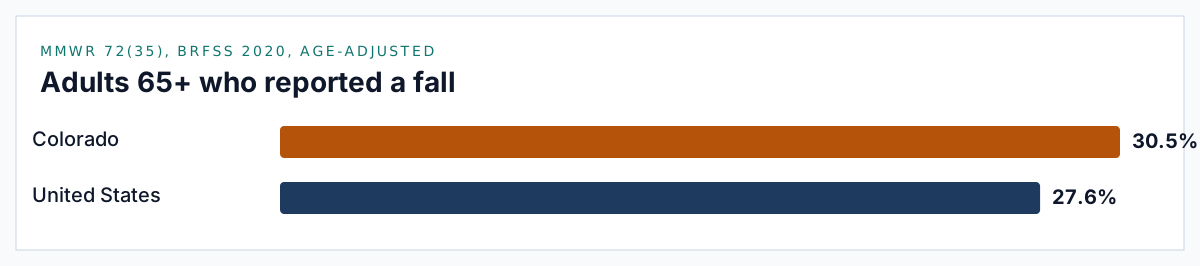
Colorado sits above the national older-adult fall picture on the best published age-adjusted pair we have: 30.5% of adults 65+ reported a fall in 2020, and the 2021 fall death rate was 130.7 per 100,000 — against U.S. figures of 27.6% and 78.0 in the same MMWR window (MMWR, Sep 2023). A newer NCHS death file puts Colorado at 936 older-adult fall deaths in 2023 (crude rate 99.3 per 100,000). That is not a drop from 130.7 until you say the words: different year, crude vs age-adjusted (NCHS, Jun 2025).
The hospital side is thinner than CDOT crash releases. CoHID and Colorado EPHT point to an Injury Indicators dashboard, not a downloadable annual fall table. The last published statewide older-adult hospital/ED census is still CDPHE’s 2007–2015 Special Emphasis Report. A 2014 HCUP SID count of 9,649 Colorado fall hospitalizations remains the best national-methods hospital total, and it is a decade old. Every figure below is dated, linked, and labeled by definition. No settlements. No verdicts. No case-value averages.
Key Takeaways
- In 2020, 30.5% of Colorado adults aged 65+ reported one or more unintentional falls in the prior year (BRFSS, age-adjusted) (MMWR, Sep 2023).
- In 2021, Colorado’s age-adjusted unintentional fall death rate among adults 65+ was 130.7 per 100,000 — men 150.0, women 117.1 (MMWR, Sep 2023).
- Nationally in that same MMWR window, 14 million (27.6%) older adults reported falling in 2020, and 38,742 died from unintentional falls in 2021 (78.0 per 100,000) (MMWR, Sep 2023).
- CDC’s current falls-data page: falls are the leading cause of injury and of injury-related death among adults 65+; the U.S. age-adjusted fall death rate rose from 64.7 per 100,000 in 2018 to 78.4 in 2024 (a 21% increase) (CDC, Feb 2026).
- NCHS final 2023 mortality: 936 Colorado residents aged 65+ died of unintentional falls; the crude state rate was 99.3 per 100,000 versus 69.9 nationally (NCHS, Jun 2025).
- CDPHE’s last published older-adult census (2015): 728 deaths, 8,208 hospitalizations, and 20,463 emergency-department visits among residents 65+ (CDPHE, Oct 2016).
- HCUP SID, 2014: 9,649 older-adult fall hospitalizations in Colorado (historical; readmissions not stripped) (JPHMP, Mar 2019).
- America’s Health Rankings’ 2023 BRFSS analysis: 29.4% of Colorado adults 65+ reported falling in the past 12 months (rank 28; U.S. 27.8%) (America's Health Rankings, May 2026).
- Colorado State Demography Office vintage estimates: 953,494 residents aged 65+ in 2023 and 983,466 in 2024 — the fastest-growing age group in the state (Colorado SDO, Sep 2026).
- CDC: about 37% of older adults who fall report an injury that needed medical treatment or restricted activity for at least a day, about nine million fall injuries (CDC, Feb 2026).
- Each year, about 3 million U.S. emergency-department visits and about 1 million hospitalizations among older adults are fall-related (CDC, Jan 2026).
- CDPHE routes Colorado clinicians to CDC STEADI (Screen, Assess, Intervene) as the clinical fall-prevention framework (CDPHE, Sep 2026).
How often do older Coloradans report falling?
Self-report is not a hospital stay and it is not a death certificate. BRFSS asks community-dwelling adults how many times they fell in the past 12 months. Nursing-home residents are out of the sample. The answer is a percentage, age-adjusted to the 2000 U.S. standard, not a police report.
What share of Colorado adults 65+ reported a fall in the latest BRFSS year published in MMWR?
MMWR 72(35) is still the best published Colorado row with sex-specific age-adjusted percentages and a national comparison in the same table.
- 30.5% of Colorado adults 65+ reported one or more unintentional falls in 2020 (age-adjusted; 95% CI 28.5–32.6), significantly higher than the U.S. 27.6% (MMWR, Sep 2023).
- Colorado women: 30.0% (27.2–32.9) (MMWR, Sep 2023).
- Colorado men: 31.2% (28.1–34.2), marked statistically higher than the national male percentage (MMWR, Sep 2023).
- Nationally, women reported falls more often than men — 28.9% vs 26.1% — the opposite of Colorado’s male-higher reporting row (MMWR, Sep 2023).
- BRFSS created a dichotomous “one or more falls” variable from the question “In the past 12 months, how many times have you fallen?” (responses 0–76) (MMWR, Sep 2023).
- The 2020 analytic sample excluded 8,297 respondents with missing, “don’t know,” or refused fall answers, leaving 127,724 (MMWR, Sep 2023).
- Percentages were age-adjusted by the direct method to the 2000 U.S. Census standard using age groups 65–74, 75–84, and ≥85 (MMWR, Sep 2023).
- America’s Health Rankings, analyzing 2023 BRFSS (not age-adjusted the MMWR way): Colorado 29.4%, U.S. 27.8%, rank 28 of states with data (America's Health Rankings, May 2026).
- In that 2023 ranking, New Jersey was lowest at 22.0% and Montana highest at 35.3% (comparison) (America's Health Rankings, May 2026).
- Neighbor-state 2023 BRFSS reporting (comparison, same AHR table): Arizona 26.1%, New Mexico 27.7%, Utah 29.5%, Wyoming 32.2%, Kansas 32.9% (America's Health Rankings, May 2026).
How does that compare with earlier Colorado BRFSS years?
CDPHE’s Special Emphasis Report used Colorado BRFSS 2014, not the MMWR 2020 row. Different year, same survey family, slightly different published percentage.
- In 2014, an estimated 27.1% of Colorado adults 65+ reported a fall in the past 12 months (CDPHE, Oct 2016).
- Of those who fell, 34.9% reported a fall-related injury in the past 12 months (CDPHE, Oct 2016).
- MMWR’s 2014 national BRFSS table listed Colorado at 27.1% reporting a fall (374,000 falls; rate 601 per 1,000) and 9.4% reporting a fall injury (85,000 injuries; rate 137 per 1,000) (MMWR, Sep 2016).
- That 2014 Colorado injury percentage was marked significantly lower than the U.S. 10.7% (MMWR, Sep 2016).
- Coloradans 65+ with depression reported falls at 41.9%; poor mental health (14+ days) 38.4%; activity limitation 39.0%; fair or poor general health 36.8% (CDPHE, Oct 2016).
- Among those with selected chronic conditions, reported-fall shares were arthritis 31.7%, diabetes 33.9%, asthma 35.4%, and stroke 42.2% (CDPHE, Oct 2016).
BRFSS 2014 at 27.1% and BRFSS 2020 at 30.5% are not a clean trend line until you keep the age-adjustment and sample caveats. They are two dated measurements of the same question family.
How deadly are falls for older adults in Colorado?
Death rates in these tables are NVSS underlying-cause deaths coded W00–W19. They are not “fall-related” multiple-cause mentions, and they are not hospital discharges that ended in death.
What was Colorado’s age-adjusted unintentional fall death rate among adults 65+?
- 130.7 per 100,000 in 2021 (95% CI 122.2–139.2), significantly higher than the U.S. 78.0 (MMWR, Sep 2023).
- Falls were identified as the underlying cause using ICD-10 W00–W19 (MMWR, Sep 2023).
- Death rates used 2021 NVSS via CDC WONDER, age-adjusted to the 2000 U.S. standard (MMWR, Sep 2023).
- CDPHE’s older published series: age-adjusted fall death rates among Colorado residents 65+ rose 47% from 75.4 per 100,000 in 2007 to 110.6 in 2015 (CDPHE, Oct 2016).
- In 2015 CDPHE counted 728 deaths among residents 65+ (CDPHE, Oct 2016).
- Residents 65+ accounted for 86% of all Colorado fall deaths in 2015 (CDPHE, Oct 2016).
- Age-specific 2015 death rates: 65–74 19.7, 75–84 104.7, 85+ 512.6 per 100,000 (CDPHE, Oct 2016).
- The 85+ death rate rose 60% from 320.2 in 2007 to 512.6 in 2015 (CDPHE, Oct 2016).
- Adults 85+ had 25 times the fall death rate of adults 65–74 in that 2015 table (CDPHE, Oct 2016).
- White non-Hispanic residents 65+ had a 2015 death rate of 146.6 per 100,000 (647 deaths); Hispanic 105.3 (53 deaths); Black non-Hispanic 58.5 (7 deaths) (CDPHE, Oct 2016).
- MMWR 67(18) noted Colorado as one of three states where fall-death rates increased, then stabilized, during 2007–2016 (comparison of trend shape, not a 2023 rate) (MMWR, May 2018).
How do men and women compare inside Colorado?
Nationally, women report more falls; men die of them at higher rates. Colorado’s 2021 death row follows the death-rate pattern.
- 2021 age-adjusted Colorado death rates: men 150.0 per 100,000 (135.6–164.4), women 117.1 (106.6–127.6); both marked higher than the national sex-specific rates (MMWR, Sep 2023).
- U.S. 2021: men 91.4 per 100,000, women 68.3 (MMWR, Sep 2023).
- CDPHE 2015: 331 male deaths (rate 126.5) and 397 female deaths (rate 98.0) among residents 65+ (CDPHE, Oct 2016).
- The 2015 male rate was 28.5 per 100,000 higher than the female rate — 29% higher (CDPHE, Oct 2016).
- From 2007 to 2015, Colorado fall-death rates rose 42% among males and 48% among females (CDPHE, Oct 2016).
- Nonfatal injury is the reverse sex pattern: 2015 female nonfatal rate 5,070.9 hospitalizations+ED visits per 100,000 vs male 3,269.9 (CDPHE, Oct 2016).
- Female hospitalizations in 2015 ran 1.5 times the male rate (1,466.9 vs 947.9 per 100,000, age-adjusted) (CDPHE, Oct 2016).
If a fall in Denver left a hip, a head injury, or a long hospital stay, the census on this page will not value the claim. A free consult with a Denver slip and fall attorney is the legal next step — after the medical one.
What does a fresher NCHS year show for Colorado deaths?
NCHS Data Brief 532 is final 2023 NVSS. Table 4 rates are crude, not the MMWR age-adjusted 130.7.
- Colorado: 936 unintentional fall deaths among adults 65+ in 2023; 99.3 per 100,000 (NCHS, Jun 2025).
- United States: 41,400 deaths; 69.9 per 100,000 (NCHS, Jun 2025).
- U.S. men 74.2 vs women 66.3 per 100,000 in 2023 (NCHS, Jun 2025).
- U.S. age-specific 2023 rates: 65–74 19.2, 75–84 74.7, 85+ 339.5 per 100,000 (NCHS, Jun 2025).
- Among U.S. adults 85+, men 373.3 and women 319.7 per 100,000 (NCHS, Jun 2025).
- Neighbor-state 2023 crude rates (comparison, same table): Arizona 79.2 (1,136 deaths), New Mexico 60.4 (253), Utah 79.4 (331), Wyoming 71.5 (80), Kansas 82.8 (425) (NCHS, Jun 2025).
- Range of the 2023 state table: Alabama 29.5 (lowest) to Wisconsin 158.4 (highest) (NCHS, Jun 2025).
- U.S. 85+ rates roughly doubled for men from 178.3 (2003) to 373.3 (2023) and rose 2.5 times for women from 128.5 to 319.7 (NCHS, Jun 2025).
How does Colorado compare with the U.S. older-adult fall picture?
Colorado is not the national average with a mountain view. In the MMWR 2020–2021 window it sat in the high-reporting, high-death group. Label every comparison as comparison.
How many U.S. older adults reported falling — or died from falls — in the MMWR window?
- 14,058,840 older adults (weighted) reported one or more falls in 2020 — 27.6% (27.0–28.2) (MMWR, Sep 2023).
- 38,742 unintentional fall deaths in 2021 — 78.0 per 100,000 (77.2–78.8) (MMWR, Sep 2023).
- Reporting ranged from 19.9% (Illinois) to 38.0% (Alaska) (MMWR, Sep 2023).
- Death rates ranged from 30.7 per 100,000 (Alabama) to 176.5 (Wisconsin) (MMWR, Sep 2023).
- Florence et al. estimated $49.5 billion in annual U.S. medical costs for older-adult falls (JPHMP, Mar 2019).
Neighbor-state comparison (labeled comparison)
Western Census Region reporting in 2020 was 30.4% among women and 26.1% among men — Colorado’s overall 30.5% sits with that region, not with the Northeast (MMWR, Sep 2023).
- Arizona 2020 reporting (comparison): women 27.5%, men 27.0% (MMWR, Sep 2023).
- New Mexico 2020 reporting (comparison): women 33.7%, men 33.1%, both marked above the national percentage (MMWR, Sep 2023).
Why public-health agencies treat falls as a leading injury problem
The leading-cause language is national. It explains why CDPHE built an older-adult fall program. It is not a Colorado hospital total.
What does CDC say about falls as a leading cause of injury and injury death among adults 65+?
- Falls are the leading cause of injury for adults ages 65+ (CDC, Feb 2026).
- Falls are the leading cause of fatal and nonfatal injuries among older adults (CDC, Feb 2026).
- Over 14 million, or about 1 in 4, older adults report falling each year (CDC, Feb 2026).
- The U.S. age-adjusted fall death rate increased 21% from 64.7 per 100,000 in 2018 to 78.4 in 2024 (CDC, Feb 2026).
- That 2018–2024 death-rate series is NVSS Multiple Cause of Death files on CDC WONDER, released 2026, accessed by CDC on Feb 24, 2026 (CDC, Feb 2026).
- About 3 million emergency-department visits each year are due to older-adult falls (CDC, Jan 2026).
- About 1 million fall-related hospitalizations occur among older adults each year (CDC, Jan 2026).
- In 2019, 83% of hip-fracture deaths and 88% of hip-fracture ED visits and hospitalizations were caused by falls (CDC, Jan 2026).
- Nearly 319,000 older people are hospitalized for hip fractures each year (CDC, Jan 2026).
- Falls are the most common cause of traumatic brain injuries (CDC, Jan 2026).
- The National Institute on Aging: more than one in four people age 65+ fall each year, and the risk of falling and of fall-related problems rises with age (NIA, Sep 2022).
- NIA lists sarcopenia, postural hypotension, medication side effects, and home hazards among fall causes — clinical risk factors, not premises-notice elements (NIA, Sep 2022).
- Healthy People 2030 includes objectives to reduce fall-related deaths among older adults (IVP-08) and to reduce ED visits due to falls among older adults (OA-03) (ODPHP, Sep 2026).
Where do Colorado fall hospitalizations show up in state systems?
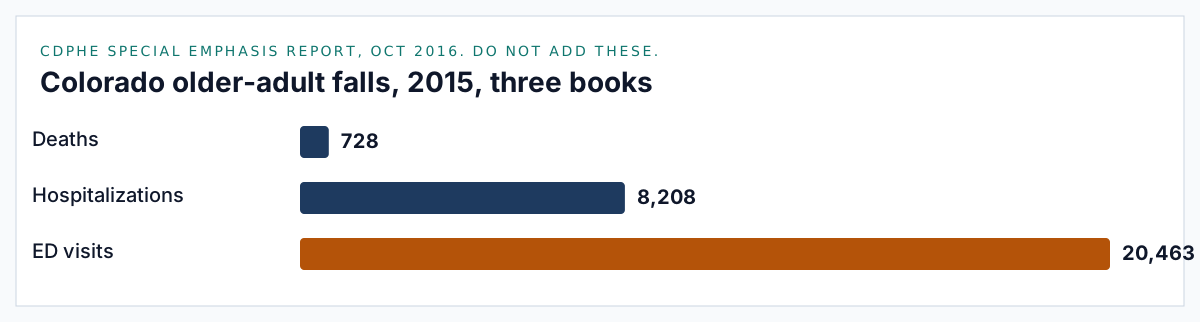
A hospitalization is a discharge code. An ED visit is a treat-and-release code. A death is a vital-statistics underlying cause. CDPHE says so by publishing them in separate columns. Adding 8,208 to 20,463 to 728 invents a fourth definition.
What official Colorado dashboards exist for injury hospitalizations (CoHID / EPHT)?
Phase B queried these pathways on 2026-09-08/09. The dashboards exist. A year×sex×age fall-hospital export did not come off the landing CSV.
- CoHID is CDPHE’s public entry to state and local health datasets, including an Injuries tile that opens the Injury Indicators dashboard (CoHID, Sep 2026).
- Colorado death statistics are published as three Tableau workbooks: deaths 2000–2025 without race; deaths 2020–2025 with updated race categories; deaths 2000–2019 bridged race (CDPHE, Sep 2026).
- Those three workbooks exist because 2020 Census race categories are not fully comparable with 2000–2019 bridged-race vital statistics (CDPHE, Sep 2026).
- Colorado EPHT’s injury-hospitalizations page is the state tracking program’s hospital-injury entry (Colorado EPHT, Sep 2026).
- EPHT’s “Explore the data” control opens the Injury Indicators dashboard (Tableau) (Colorado EPHT, Sep 2026).
- The same EPHT page points requesters to CDPHE’s data-request form for custom reports (Colorado EPHT, Sep 2026).
- EPHT also points to the Colorado Trauma Registry as a related system, not as a public fall-count table (Colorado EPHT, Sep 2026).
- The Trauma Registry page is facility submission documentation (2025–2026 data dictionaries, ImageTrend) — not a fall census (CDPHE, Sep 2026).
- CDPHE’s injury data and epidemiology index lists the Injuries in Colorado Dashboard, CoHID, death-certificate access, and WISQARS as general injury sources (CDPHE, Sep 2026).
- A GET of the Injury Indicators landing CSV on 2026-09-09 returned a dashboard file-row metric, not a fall hospitalization total; do not treat that extract as burden (Colorado EPHT, Sep 2026).
- CoHID population estimates (the denominator for rates) are a separate Tableau view maintained with the State Demography Office (CoHID, Sep 2026).
What did CDPHE last publish as a statewide older-adult hospital and ED census?
The Special Emphasis Report (released October 2016) is still the last narrative statewide older-adult fall hospital/ED package with sex, age, race, hip fracture, and cost tables. 2015 hospital/ED figures used ICD-9-CM across a coding-transition year — CDPHE says so in the definitions footnote.
- 8,208 hospitalizations and 20,463 ED visits among residents 65+ in 2015, plus 728 deaths — “almost 29,000” fall-related injuries treated at hospitals and EDs (CDPHE, Oct 2016).
- Nonfatal total in Table 1: 28,671 hospitalizations+ED visits; age-adjusted nonfatal rate 4,292.2 per 100,000 (CDPHE, Oct 2016).
- Each week in that 2015 snapshot: 394 ED discharges, 158 inpatient hospitalizations, and 14 deaths among residents 65+ (CDPHE, Oct 2016).
- Residents 65+ were 22% of hospitalizations for fall-related injuries in Colorado in 2015 (CDPHE, Oct 2016).
- Age-adjusted hospitalization rates among residents 65+: 1,548.7 per 100,000 in 2007, down to 1,036.1 in 2013, then 1,237.2 in 2014 and 1,250.8 in 2015 (CDPHE, Oct 2016).
- 2015 hospitalizations by age: 65–74 2,080, 75–84 2,913, 85+ 3,215 (CDPHE, Oct 2016).
- 2015 ED visits by age: 65–74 7,557, 75–84 6,793, 85+ 6,113 (CDPHE, Oct 2016).
- Nonfatal injury rates by age: 65–74 2,232.0, 75–84 4,982.2, 85+ 10,892.6 per 100,000 (CDPHE, Oct 2016).
- Of 8,208 hospitalizations, 3,147 (38%) were for treatment of a hip fracture (CDPHE, Oct 2016).
- 5,126 (62%) of those 8,208 hospitalizations discharged to a skilled nursing facility; 15% discharged home (CDPHE, Oct 2016).
- Among hip-fracture hospitalizations, 76% went to SNF, 10% to rehabilitation, 6% home with home-health, 5% home (CDPHE, Oct 2016).
- Falls accounted for 27% of all Colorado TBI deaths and 42% of TBI hospitalizations and ED visits; among older adults, 36% of fall-injury deaths, 16% of hospitalizations, and 22% of ED visits mentioned TBI (CDPHE, Oct 2016).
- 2014 lifetime-cost table in the same report (WISQARS cost module): 677 deaths, 7,847 hospitalizations, 18,829 ED visits — combined $738.8 million (CDPHE, Oct 2016).
- That 2014 cost split: medical $400.5 million, work-loss $338.3 million (CDPHE, Oct 2016).
- Hospitalizations drove most of the 2014 cost: $322.4 million medical and $236.8 million work-loss ($559.2 million combined) (CDPHE, Oct 2016).
- SER definitions: death = ICD-10 W00–W19; hospital/ED = ICD-9-CM injury diagnosis plus first-listed external cause E880–E886 or E888; 2015 hospital/ED estimates mixed Q4 2014 with the first three quarters of 2015 (CDPHE, Oct 2016).
Hospital counts are CHA discharge data analyzed by CDPHE, not a courtroom inventory. If the injury happened on someone else’s property in Denver, the premises page is Denver premises liability lawyers; this hub will not add a settlement column.
What historical primary count exists for Colorado older-adult fall hospitalizations?
- Haddad, Bergen, and Florence (HCUP SID, 2014): 9,649 older-adult fall hospitalizations in Colorado (JPHMP, Mar 2019).
- Applying WISQARS’ national average lifetime medical cost for a fall hospitalization ($41,091, 2014 USD) produced $396 million for that Colorado hospital count (JPHMP, Mar 2019).
- Colorado was not among the 12 SID states where VisitLink could strip same-year readmissions (those states’ readmission rates were 4–9%) (JPHMP, Mar 2019).
- Colorado had no 2014 SEDD treated-and-released ED count in the 17-state ED table (JPHMP, Mar 2019).
- National WISQARS average lifetime medical cost for an ED treat-and-release fall in that paper: $3,294 (2014 USD) (JPHMP, Mar 2019).
- Florence’s attributable-fraction inputs used in the same paper: falls constituted 6.0% of Medicare spending, 8.0% of Medicaid spending, and 5.0% of private/out-of-pocket spending on older adults (JPHMP, Mar 2019).
- CDPHE’s 2014 hospital count in the cost table is 7,847, not 9,649 — CHA vs HCUP SID, different case definitions. Keep both. Do not average them (CDPHE, Oct 2016).
How large is the older-adult population these rates sit on?
- Colorado State Demography Office: 953,494 residents 65+ in 2023 and 983,466 in 2024; 2030 forecast 1,136,338 (Colorado SDO, Sep 2026).
- SDO total population: 5,900,418 (2023) and 5,956,728 (2024) (Colorado SDO, Sep 2026).
- ACS 2019–2023 5-year (different vintage from SDO): Colorado 882,557 people 65+ (15.2% of the population) (Census, Sep 2026).
- That same ACS table: 331,411 Coloradans were 75+ (5.7%) and 1,233,373 were 60+ (21.2%) (Census, Sep 2026).
- America’s Health Rankings 2025 Senior Report ranked Colorado 2nd overall for older-adult health; falls prevalence still sat at 29.4% (rank 28) (America's Health Rankings, May 2025).
- Workplace falls are a separate BLS census: 16 of Colorado’s 83 fatal occupational injuries in 2023 were falls, slips, or trips (BLS, Dec 2024).
- That BLS file is working-age occupational fatalities, not the 65+ NVSS fall census. Do not add 16 to 936 (BLS, Dec 2024).
- Colorado’s 2023 fatal occupational injuries included 35 transportation incidents and 14 violent acts alongside those 16 falls, slips, or trips (BLS, Dec 2024).
- Of those 83 occupational deaths, 69 were wage-and-salary workers and 14 were self-employed; 76 were men and 7 were women (BLS, Dec 2024).
What prevention framework does Colorado point clinicians to?
Prevention language on this page is the public-health program CDPHE actually publishes. It is not a promise that a given fall was preventable in a legal sense.
How does CDPHE route providers to CDC STEADI?
- CDPHE’s clinical-guidelines page tells Colorado providers that CDC identifies falls as the leading injury cause for adults 65+ and that older-adult falls are common, costly, and preventable (CDPHE, Sep 2026).
- The same page routes clinicians to STEADI — Stopping Elderly Accidents, Deaths & Injuries — to screen, assess, and intervene (CDPHE, Sep 2026).
- STEADI training listed by CDPHE: course WB4310R on CDC TRAIN, with CE credits (0.1 CEU/CE, 1 CHES, 1 CNE, 2 CPHCE, 1 AMA PRA Category 1) (CDPHE, Sep 2026).
- CDC STEADI’s algorithm covers fall-risk screening, assessment, and intervention for clinicians who treat older adults (CDC STEADI, Jul 2025).
- MMWR 72(35) states STEADI recommends that providers screen and assess older adults for fall risk and intervene with effective strategies (MMWR, Sep 2023).
- CDPHE lists Stepping On, Tai Chi: Moving for Better Balance, and Matter of Balance as Colorado community programs in the 2016 SER (CDPHE, Oct 2016).
- Older-adult fall prevention was one of CDPHE’s “Winnable Battles” in that report (CDPHE, Oct 2016).
- CDPHE also points professionals to NCOA’s National Falls Prevention Resource Center (CDPHE, Sep 2026).
- CDC’s facts page repeats STEADI patient resources (Stay Independent, Check for Safety, What YOU Can Do to Prevent Falls) as the public-facing toolkit (CDC, Jan 2026).
- NIA’s prevention list is the same clinical cluster: exercise, medication review, vision, and home safety — not a premises-liability checklist (NIA, Sep 2022).
- NIA recommends at least 150 minutes per week of physical activity to help keep bones strong enough to reduce fracture risk after a fall (NIA, Sep 2022).
Methodology and Sources
Stats on this page come only from origin publishers: MMWR (BRFSS + NVSS state rows), NCHS Data Brief 532 (2023 NVSS), CDC Older Adult Falls Data and Facts pages (WISQARS/NVSS), CDPHE’s 2007–2015 Special Emphasis Report (vital statistics + Colorado Hospital Association discharges + Colorado BRFSS), Haddad et al. in JPHMP (HCUP SID 2014), CoHID/EPHT/Injury Indicators system pages, Colorado State Demography Office and Census population denominators, BLS Census of Fatal Occupational Injuries (workplace only), NIA, and America’s Health Rankings’ BRFSS 2023 state ranking. Aggregator “average slip and fall” listicles are not sources. The page is refreshed monthly.
Data risks, in the order they actually break pages:
- Mechanism ≠ claim type. Unintentional-fall deaths and hospital discharges are not a count of premises-liability “slip and fall” lawsuits.
- Self-report vs death vs hospital. BRFSS falls ≠ NVSS W00–W19 deaths ≠ CHA/HCUP hospitalizations. Never sum them.
- Age-adjusted vs crude. MMWR 2021 Colorado 130.7 is age-adjusted. NCHS 2023 Colorado 99.3 is crude. They are not a trend.
- CoHID/Tableau scrape limits. Injury Indicators and CoHID Deaths are interactive. A 2026-09-09 landing-page CSV was not a fall census. Custom extracts go through CDPHE’s data-request system.
- Hospital series lag. The last published statewide older-adult fall hospital/ED narrative is 2015 (released 2016), with an ICD-9-CM coding-transition footnote. Haddad’s 9,649 is 2014 HCUP SID. Neither is a 2023–2025 hospital total.
- CHA vs HCUP. CDPHE 7,847 (2014 cost table) and Haddad 9,649 (2014 SID) use different databases and case definitions.
- BRFSS excludes long-term care. Nursing-home residents, who have higher fall risk, are out of the telephone sample.
- No case outcomes. This hub is fall-injury epidemiology. It does not publish settlements, verdicts, or case-value averages.
Glossary
- BRFSS: Behavioral Risk Factor Surveillance System (CDC/state telephone survey)
- NVSS: National Vital Statistics System (death certificates)
- WISQARS: Web-based Injury Statistics Query and Reporting System (CDC)
- NCHS: National Center for Health Statistics
- CoHID: Colorado Health Information Dataset
- EPHT: Environmental Public Health Tracking (Colorado and national)
- CHA: Colorado Hospital Association discharge data
- HCUP SID: Healthcare Cost and Utilization Project State Inpatient Databases (AHRQ)
- ICD-10 W00–W19: underlying-cause codes for unintentional falls
- STEADI: Stopping Elderly Accidents, Deaths & Injuries (CDC clinical initiative)
- Age-adjusted: standardized to the 2000 U.S. population (65–74, 75–84, ≥85) unless a source says otherwise
- Crude rate: deaths divided by population, not age-standardized
Sources
- MMWR 72(35), Kakara et al., Nonfatal and Fatal Falls Among Adults Aged ≥65 Years — United States, 2020–2021
- MMWR 69(27), Moreland et al., Trends in Nonfatal Falls and Fall-Related Injuries, 2012–2018
- MMWR 67(18), Burns and Kakara, Deaths from Falls Among Persons Aged ≥65 Years, 2007–2016
- MMWR 65(37), Bergen et al., Falls and Fall Injuries Among Adults Aged ≥65 Years — United States, 2014
- CDC Older Adult Falls Data
- CDC Facts About Falls
- CDC STEADI
- CDC WISQARS
- CDC WONDER underlying cause of death
- NCHS Data Brief 532, Unintentional Fall Deaths in Adults Age 65 and Older: United States, 2023
- CDPHE Special Emphasis Report: Fall Injuries among Older Adults, 2007–2015
- CDPHE clinical guidelines for fall prevention
- CDPHE injury data and epidemiology
- CoHID
- CDPHE Colorado death statistics
- Colorado EPHT injury hospitalizations
- Injury Indicators dashboard
- Colorado Trauma Registry
- Haddad, Bergen, Florence, Estimating the Economic Burden Related to Older Adult Falls by State (JPHMP 2019)
- America's Health Rankings, Falls — Age 65+ in Colorado
- Colorado State Demography Office
- Census ACS 2023 5-year, Colorado S0101
- BLS, Fatal occupational injuries in Colorado, 2023
- National Institute on Aging, Falls and Fractures in Older Adults
- Healthy People 2030, Reduce fall-related deaths among older adults (IVP-08)